The Number of Homes for Sale on the market, often referred to as the Inventory Level, represents the number of active homes for sale on the market at any given time. All homes that are publicly listed by home sellers are considered apart of the inventory. This graph illustrates the inventory levels over time in the Pacific Palisades for Single Family Homes vs Condominiums or Townhomes.
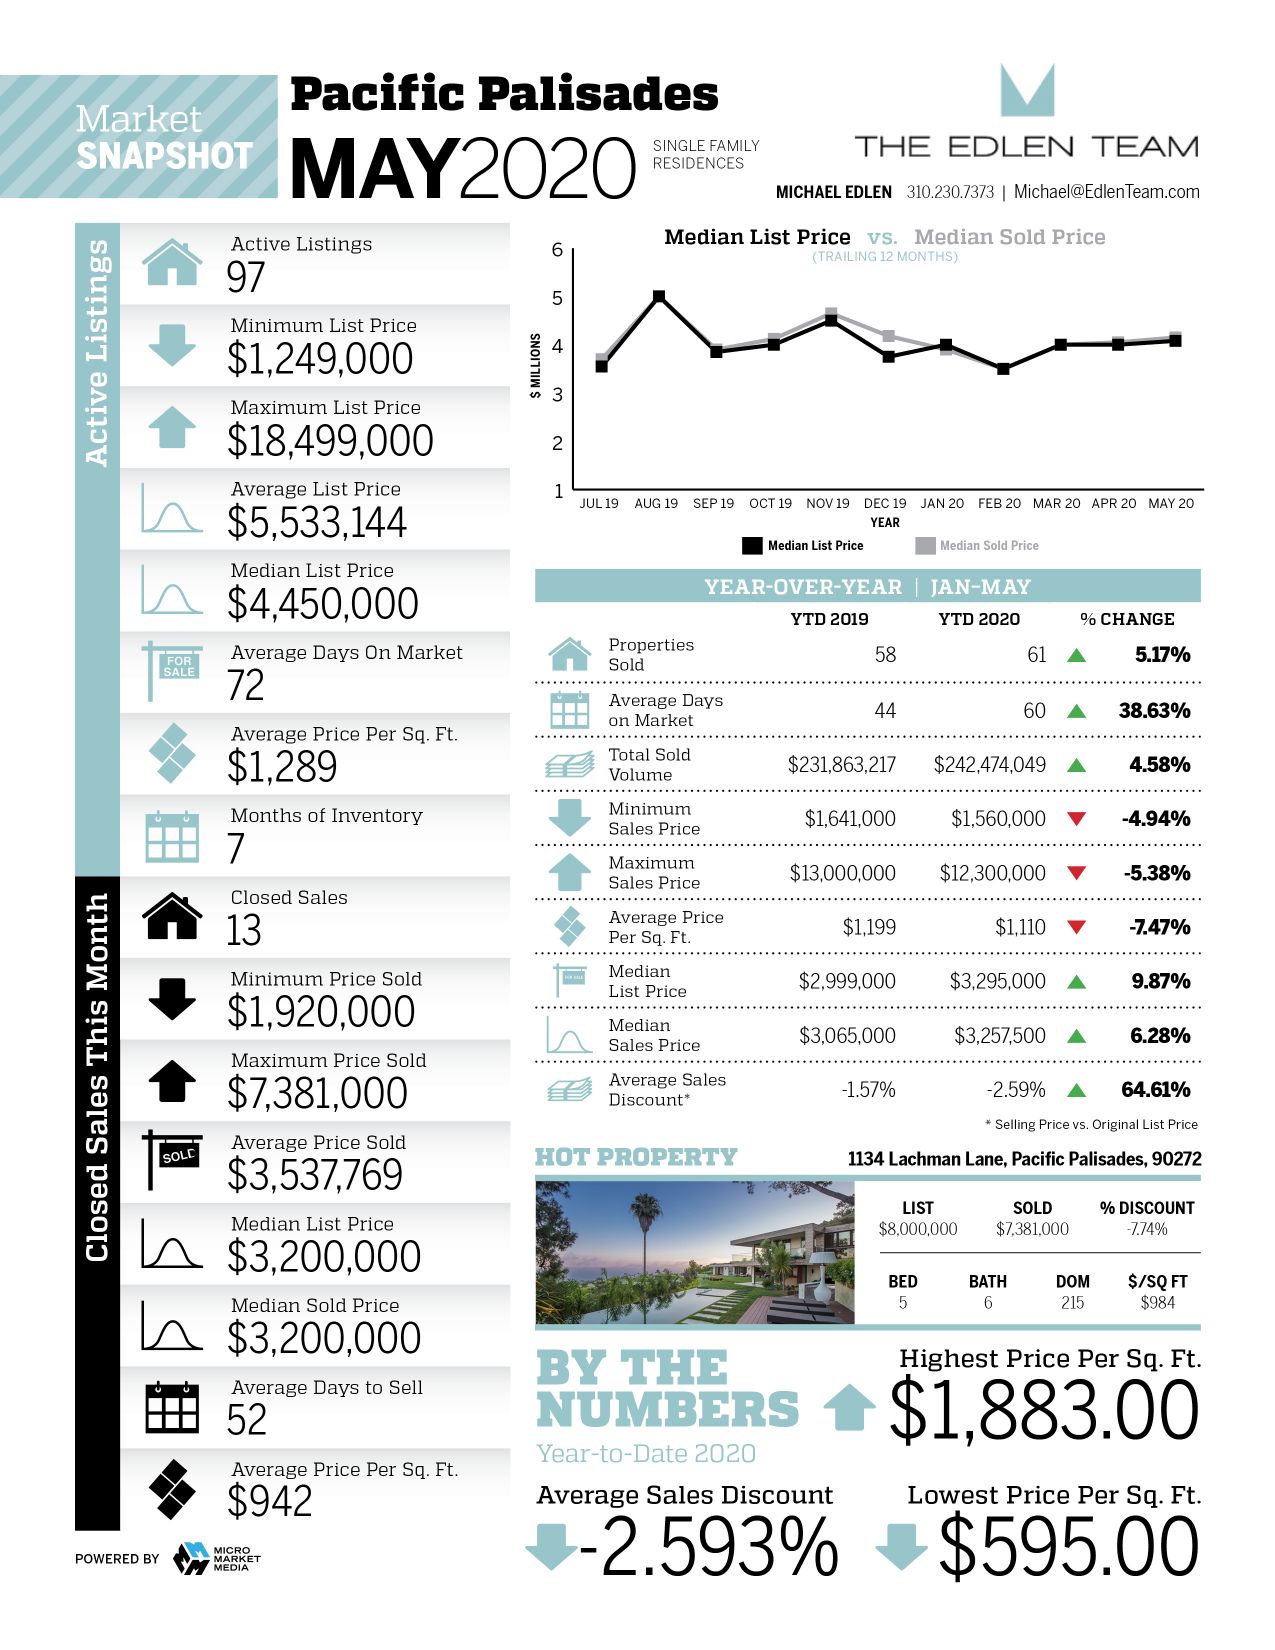
The median price is the mid-point of a real estate market, where 50% of the home prices are both above and below that mid-point. In real estate, it is often considered the more accurate number to use compared to the average home price, since market extremes will skew the average price up or down more than the median price. This graph shows the median price of the Pacific Palisades over time of Single Family Homes vs Condominiums or Townhomes.
The Median Days on Market is a measure of how long it is taking to sell the typical home. Days on Market refers to the number of days a property has been publicly for sale. The lower the number of days on market, the more it favors sellers who can often see multiple offers and prices over asking. The higher the days on the market, the more it favors buyers who can be more selective and it may influence listings to have price reductions.
The median price per square foot is a derivative measure of median price, that takes the median price and divides it by the total amount of livable square footage a home has. Popular and luxury neighborhoods often have higher prices per square foot compared to more typical residential areas due to supply and demand. However, often smaller homes will have a higher price per square foot compared to a larger home in the same area simply because of math and the way homes are priced by home sellers. Every individual home’s costs, benefits and characteristics must be considered since the price per square foot does not capture a property’s selling points, only its size in relation to its price.
The number of closed sales refers to the number of properties that are successfully sold in a neighborhood. Many properties are listed for sale and never sell for one reason or another. There are many reasons a seller may cancel a listing so while obviously related, the number of homes for sale does not always equal the number of homes sold.
The Dollar Volume of Closed Sales refers to the dollar value of the inventory of homes sold at any given time. It is considered a strong indicator of the health of a real estate market, with long-term uptrends in price growth suggesting market strength and long-term downtrends of price declines suggesting market weakness.
Months Supply of Inventory is a measure that attempts to estimate the number of days it would take to completely clear the current level of homes for sale if no other homes came onto the market. Similar to Days on Market, the lower the months of inventory the more it favors sellers who are seeing homes sell faster or stronger offers from buyers. The higher the months of inventory, the more it favors buyers who are seeing more inventory available and can negotiate for better terms. 90 days of inventory is often considered neutral for a typical market, however luxury home markets naturally have longer sell cycles and therefore can have larger supplies of inventory available.
Median Percent of Last List Price, often referred to as the List-to-Sales Price Ratio, refers to the typical amount a seller might reduce a property when listing it for sale before it is sold. A List-to-Sales price of 100% would mean the list price and the actual sale price of a home were exactly the same. It is common to see a discount of 1-2% in most neighborhoods with a healthy market. Consistent discounts greater than 1-2% often suggest broader market weakness.
*All graphs are on a 12-month rolling basis to reduce market fluctuations that may be more short-term or seasonally driven
If you have any questions, concerns or want to learn more about how the Edlen Team can help you find your next dream home, don’t hesitate to contact us
Get latest listings, market trends, and opportunities in your inbox.
[hubspot type=form portal=6403744 id=3c343aa4-3318-4548-b684-39ca91db0acd]